 WinVotes
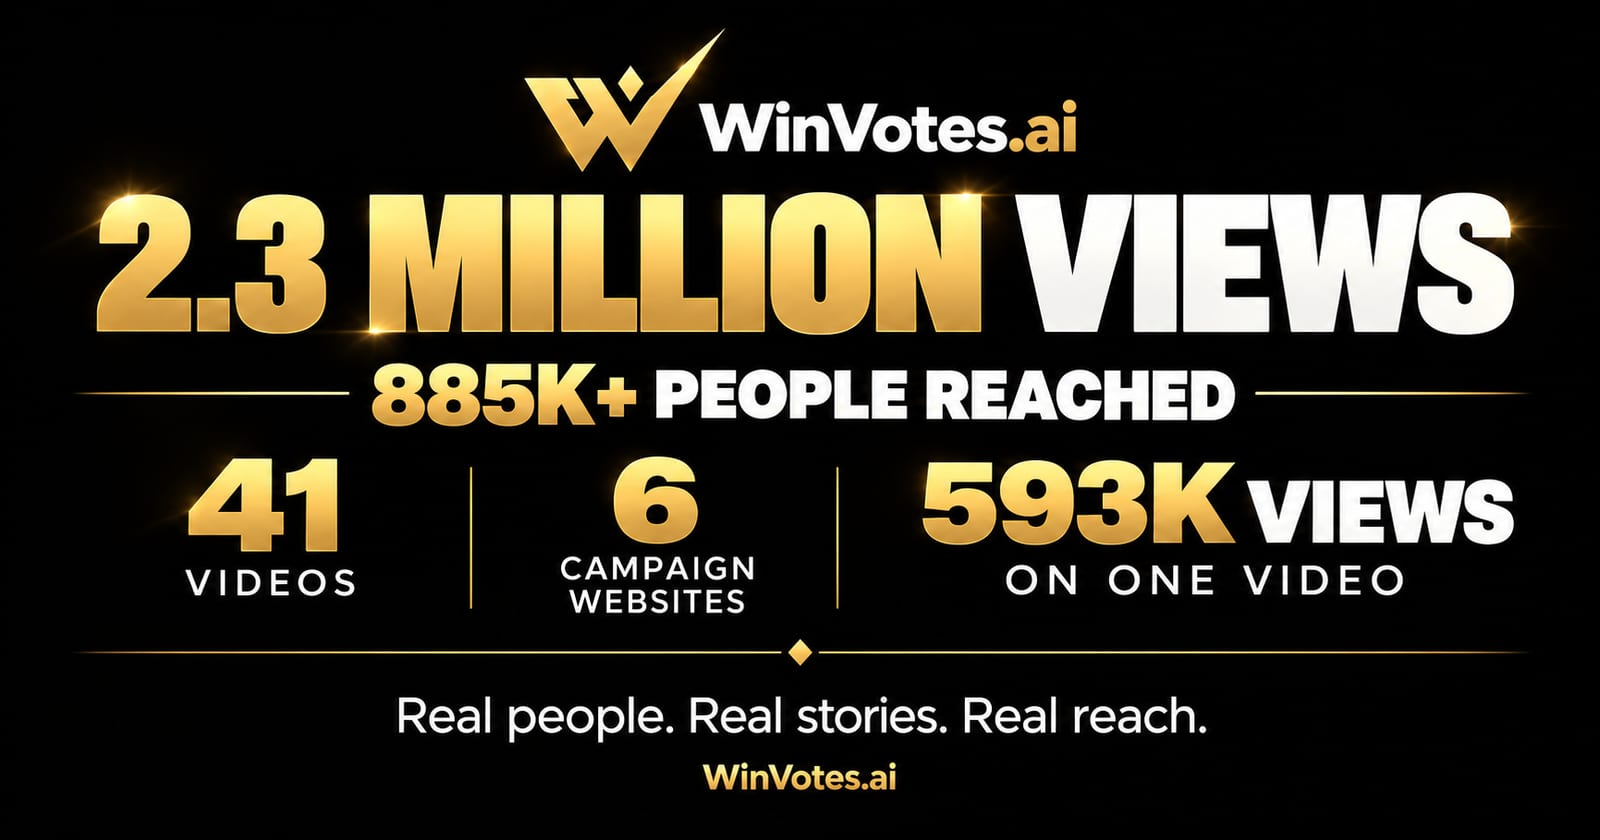
Early voting runs October 19 to 31, and Election Day is November 3. Every race we are supporting is in its final push, which makes this the right moment to put the full numbers on the table.
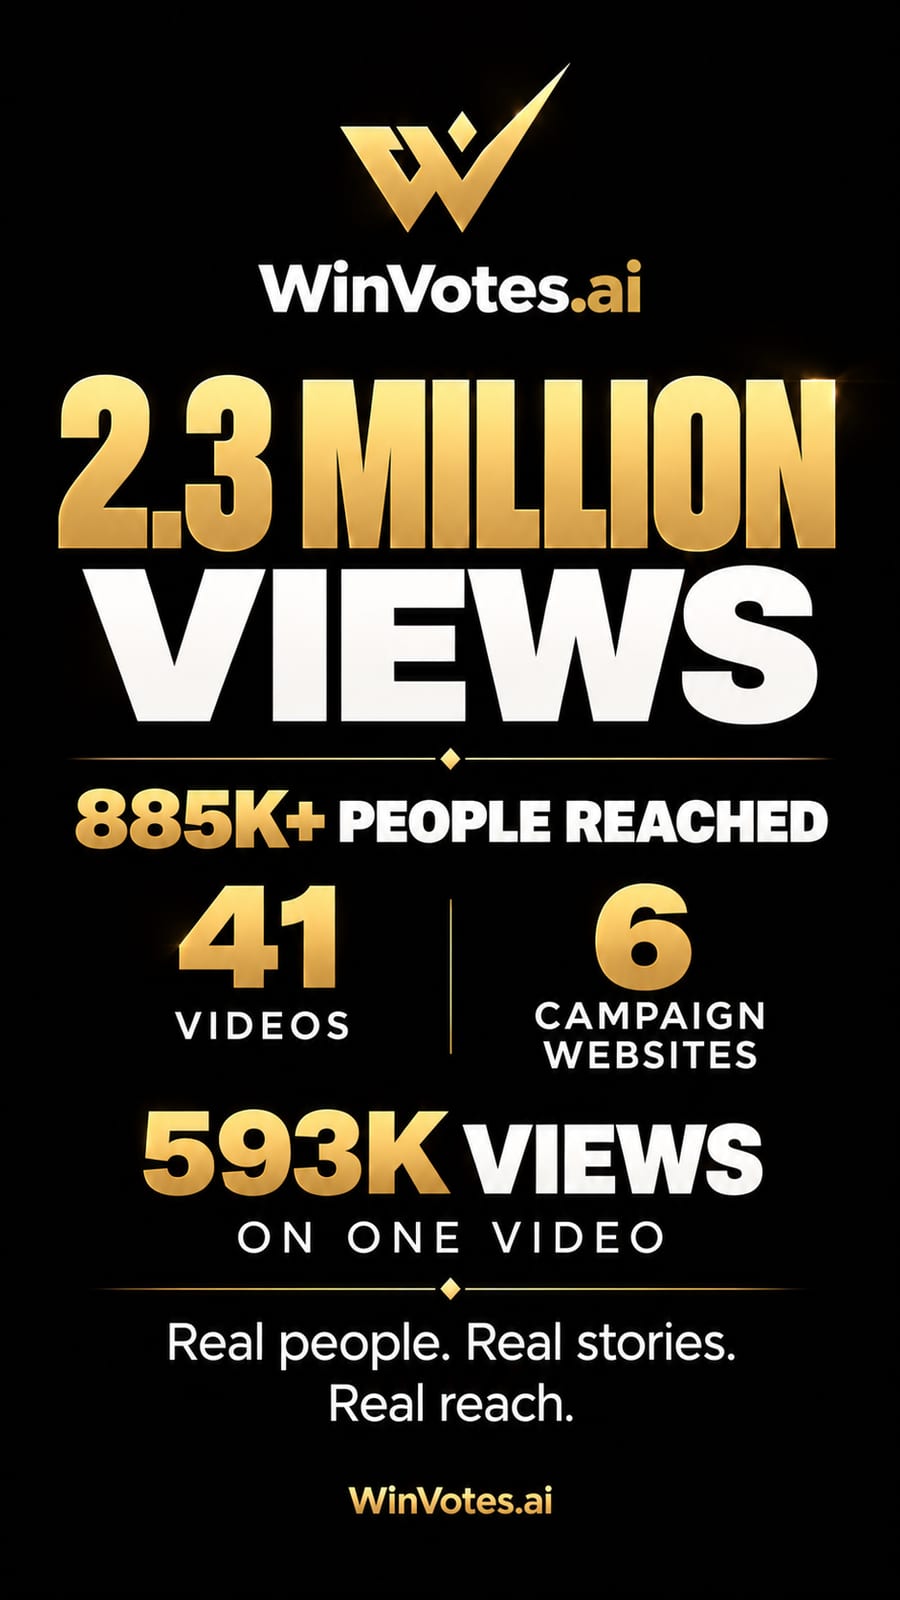
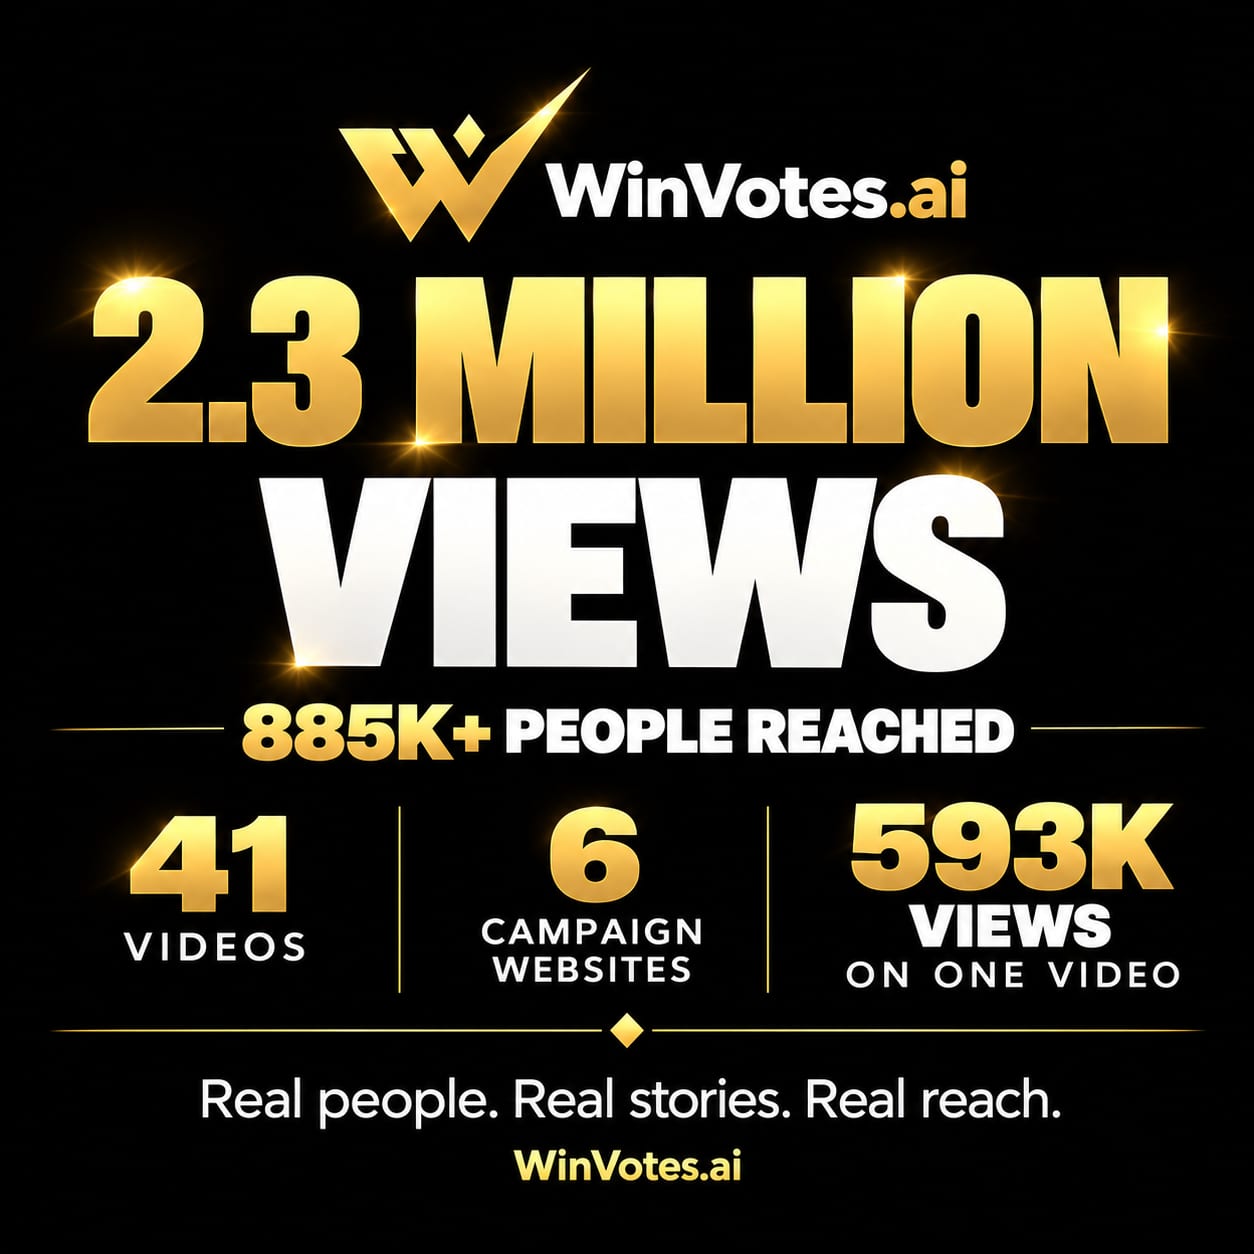
Since March 2026, WinVotes.ai has run digital operations for five local races: a sheriff's race, a county representative race, a school board race, and two town council races. We also built six campaign websites along the way. Here is what the data shows, including the parts that need an asterisk.
The Headline Numbers
What the numbers actually say
One video pulling 593K views is a great story, but it is not the story. The real signal is that 2.3 million views came from five very different races, from a countywide sheriff's contest to a single school board district.
The playbook travels: short, vertical, human video built around real people and real neighbor endorsements, backed by a campaign website and a lead capture system.
Race by Race
Every race is different. Here is how each one performed, with no names attached.
The longest runway and the biggest numbers.
81.8K views in under 3 months.
A single-district race with a loyal local audience.
Strong reach from a small, focused ward.
Steady views with a tighter reach.
The Content Earned More Than the Spend Bought
In the sheriff's race, 1.19 million views were organic, compared with 911K from paid ads. The content earned more attention than the budget purchased.
That matters because ad dollars rent attention, while content people actually watch and share builds it. Paid still has a role. It extends the reach of what is already working. But it performs best when the creative underneath is already strong.
Ads rent attention. Good content earns it. The best results come from doing both.
An 8-Month Track Record, Not a One-Off
This work spans March through October 2026. The sheriff's race has been running since March. The county representative race picked up 81.8K views in under three months. Long runways build momentum, and short runways still perform.
Every race is active right now, heading into early voting and Election Day. That is the point of a consistent operation: no single viral moment carries it, and nothing stalls in the final stretch.
What Sits Behind the Numbers
Each campaign runs on the same stack: a website built on our AI-powered platform and CRM, lead capture that logs every sign-up and alerts the campaign right away so no supporter or volunteer lead sits unread, and short vertical video built for the feed.
See It in the Feed
This is what the work looks like where voters actually see it.
The Fine Print
- Reach is summed across posts, not deduplicated. Someone who saw three posts counts three times.
- Video views are 3-second views, which is Meta's standard.
- Date ranges differ by race, so combined totals mix time windows.
- Totals include both organic and paid views.
Running in 2028? Let's build your numbers.
Tell us about your race and we will show you what a full digital operation looks like.
Tell Us About Your Race